
Business Intelligence (BI) used to mean hefty OLAP engines, specialized BI teams, and long lead times. Today, small teams — and even single developers — need fast, practical insights: dashboards that answer day-to-day questions, automated reports that actually get used, and data tools that integrate with the apps people already rely on. That’s where Claris FileMaker shines: not as a replacement for enterprise BI suites, but as a pragmatic, everyday analytics hub that brings data, workflows, and action together in one place.
Why FileMaker for everyday BI?
Most businesses struggle with three BI problems:
- Data scattered across systems (spreadsheets, CRMs, local databases).
- Long delivery cycles — dashboards arrive after the problem has passed.
- Low adoption — complex tools that users don’t open.
FileMaker addresses these by letting teams collect, model, visualize, and act on data inside the same platform they use to run daily processes. Instead of exporting CSVs into another tool, you build the inputs, the logic, and the visualizations in a single custom app — reducing friction from insight to action. Practicality, speed, and direct integration with workflows are FileMaker’s BI advantages.
What “BI in FileMaker” looks like — dashboards, KPIs, and context
A FileMaker-based BI approach usually centers on these elements:
- Custom dashboards: layouts tailored to roles (sales, ops, finance) showing KPIs, trend charts, and alerts. FileMaker layouts and portals let you design dashboards that are highly contextual and interactive.
- Session and user-specific views: show each user only the metrics relevant to them (using session tables and relationships). This increases relevance and adoption.
- Drillable records: click a KPI to jump to the underlying transactions — not just a static chart. FileMaker’s relational model makes this natural.
- Export & sharing: scheduled PDF reports, CSV exports, or embedded web views for stakeholders.
Because dashboards live inside the operational app, insights are connected to the workflow: when a metric flags a problem, users can fix records immediately without context switching.
New leverage: AI and analytics in FileMaker 2025
The 2025 FileMaker release expanded how developers can turn raw data into smarter insights. Built-in AI features and easier model integration mean you can do more than show numbers — you can surface explanations, summaries, and natural-language queries over your data. That makes self-service analytics more accessible to non-technical users and speeds up decision cycles.
Practical examples:
- Ask the system “Why did revenue dip last week?” and receive a summarized answer pointing to canceled orders, low conversion rates, or a spike in returns (using local LLM or integrated AI).
- Auto-generated commentary for reports (executive summaries), saving hours in manual analysis.
Note: while AI enriches insights, design decisions about where models run (local vs cloud), data privacy, and validation are essential.
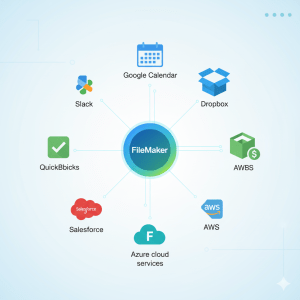
Integrations: FileMaker as the data hub (Connect, Studio, BI tools)
A realistic BI stack often mixes specialized visualization tools with an operational database. FileMaker now sits comfortably as the data hub that feeds and coordinates those tools:
- Claris Connect lets you automate data flows between FileMaker and other SaaS apps (CRMs, spreadsheets, email), enabling near real-time pipelines without heavy ETL code. That makes it simple to keep dashboards current and trigger automations from BI events.
- Claris Studio (and web embedding) can surface lightweight web dashboards to stakeholders who don’t use FileMaker directly.
- Third-party BI tools: teams that need advanced visual analytics (complex multi-source modeling, deep visualizations) can export or stream FileMaker data to tools like Tableau or Power BI. Historically, organizations have used connectors or scheduled exports to combine FileMaker’s curated data with enterprise visualization tools.
This hybrid approach keeps FileMaker as the single source of truth for business records while letting specialist tools do what they do best.
Practical blueprint: Build an everyday BI system with FileMaker
- Start with the question, not the chart. Identify 3–5 mission-critical metrics (e.g., MRR, lead response time, inventory turnover) and map the data sources.
- Model for clarity. Create clear relationships and a SESSION table (or user context table) so dashboards can be filtered per user or role.
- Design dashboard layouts. Use compact summaries, small-multiples charts (trend, breakdown, top items), and a drill-down path to transactions. Keep it actionable.
- Automate data hygiene. Use scripts and scheduled scripts in FileMaker Server or Claris Connect to normalize, aggregate, and cache metrics so dashboards remain responsive.
- Add AI-assisted insights. Use FileMaker 2025 AI features to auto-summarize anomalies or allow natural-language queries for non-technical users. Validate AI outputs and log suggestions for auditability.
- Expose & scale: embed Studio dashboards for executives or push sanitized extracts into advanced BI tools for deep analysis.
Example mini case (hypothetical but realistic)
A mid-sized distributor used FileMaker as its order and inventory system. They built a FileMaker dashboard that combined:
- real-time stock levels,
- sales velocity by SKU, and
- an AI-generated “restock risk” summary.
When the restock risk exceeded a threshold, a Claris Connect workflow created a draft purchase order and notified the buyer. The buyer could review the suggested order inside FileMaker and send it to a supplier with one click. This removed manual monitoring and cut stockouts by 40% in the first quarter.
This example illustrates how data + automation + embedded insights can turn BI from “nice to have” into daily operational muscle.
Limitations & when to combine FileMaker with specialized BI
FileMaker is exceptional for operational BI — dashboards tied closely to transactional workflows and team adoption. But there are cases where a specialized BI/analytics tool still makes sense:
- Complex cross-enterprise data models that require large-scale OLAP, semantic modeling, or advanced forecasting.
- Very large datasets where in-tool aggregation would be slower than purpose-built analytics engines.
- Organizations requiring heavy multi-user, multi-tenant visual exploration capabilities best handled in dedicated BI platforms.
In practice, many organizations use FileMaker for day-to-day insight and a specialized BI tool for deep analytical projects — a complementary, not competitive, relationship.
Conclusion — BI that works every day, not just in meetings
Reimagining BI entails a shift from large, disjointed reports to instantaneous, contextual, and actionable analytics. FileMaker excels at integrating data into workflows through automation that closes the loop, dashboards that operate where users already do, and—more and more—AI that provides clear, helpful explanations.
If your goal is to make data useful every day (not just once a quarter), FileMaker can be the practical heart of that approach: the place where records, reports, and responses meet.